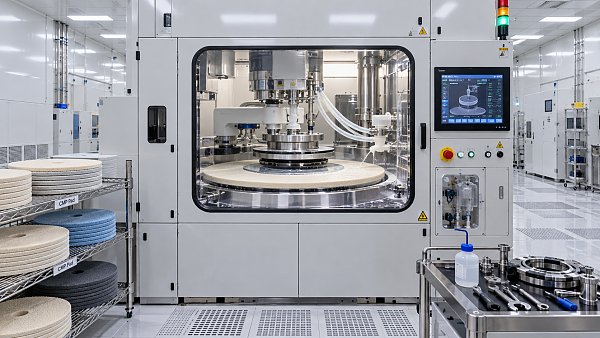
How Should You Compare CMP Equipment Uptime Claims?
Author
Date Published
Reading Time
How should you compare CMP equipment uptime claims? Start by looking beyond the headline percentage. Two suppliers may report figures that appear comparable while using different definitions, observation periods, maintenance exclusions, and operating conditions. For fab engineers and procurement teams, the useful question is not simply which number is higher, but what each tool was expected to do, what stopped it from doing so, and how much support was needed to keep it running.
A credible comparison of chemical mechanical planarization equipment connects availability to production conditions: wafer size, process recipe, consumables, product mix, maintenance practices, and local service capability. The following questions can help turn an attractive claim into evidence a purchasing team can actually use.
What does the supplier mean by uptime?
Ask for the formula before discussing the result. A common way to express availability is:
Availability = available time ÷ defined observation time × 100
That formula is only useful when both terms are defined. Does “available” mean the entire CMP system is ready to process wafers, or that a particular module is operational? Does the observation time include scheduled maintenance, idle periods, engineering work, and time spent waiting for parts? A tool may be technically available yet not producing wafers because no qualified work is ready, while a production interruption may be excluded from a supplier’s reported downtime.
Request the underlying time categories and state definitions, including how transitions between states are recorded. Suppliers may refer to SEMI E10 equipment reliability, availability, and maintainability concepts, but a reference to a standard alone does not guarantee that two reports use identical boundaries. Confirm the version, classification choices, and any deviations used in each calculation.
Which downtime is included—and which is left out?
CMP equipment has recurring planned activities as well as unexpected failures. A favorable uptime number may exclude some or all scheduled work. That can be useful for understanding hardware reliability, but it is not the same as understanding how much production time a fab will lose.
Ask suppliers to account separately for:
- Preventive maintenance: scheduled inspections, cleaning, adjustments, and replacement of wear components.
- Consumable-related work: pad changes, conditioner replacement, slurry delivery maintenance, and other activities that may require a module or the full tool to stop.
- Unplanned maintenance: failures, fault diagnosis, repair, and verification before the equipment is returned to service.
- Support delays: time waiting for a service engineer, a spare part, remote troubleshooting, or fab access.
- Process recovery: conditioning, qualification wafers, metrology, and engineering checks required after maintenance or a process excursion.
Not every organization assigns these intervals to the same category. The important step is to make them visible. If a vendor excludes process requalification because it is a fab responsibility, the fab still needs to estimate that time when comparing production impact.
Can two uptime percentages be compared directly?
Only after they have been normalized to a common scope. Consider an illustrative reporting period of 1,000 hours. Supplier A reports 950 hours available and counts the full period in its denominator, giving 95% availability. Supplier B reports 950 hours available but excludes 40 hours of planned maintenance from the denominator, giving approximately 99%.
Those percentages do not prove that B delivered more usable time. In this simplified example, both report the same available hours; the difference comes from the denominator. To compare their impact, the team would also need to know what happened during the remaining hours, whether the tools had comparable workloads, and whether qualification time was included. The figures are examples of calculation differences, not industry benchmarks.
Ask each supplier to provide raw hours by category, not just a percentage. Recalculate the results using a shared definition and keep the original supplier figures alongside the normalized comparison. If the underlying data cannot be disclosed, record that limitation rather than treating the numbers as equivalent.
How long was the equipment observed, and where?
A short demonstration can show that a system operates; it is much less persuasive as evidence of sustained manufacturing performance. An observation window should be long enough to capture the maintenance cycle and recurring interruptions relevant to the proposed application. Ask for the start and end dates, total calendar hours, production hours, and number of tools included.
Location and maturity matter too. Was the data collected at a supplier demonstration facility, during customer qualification, or in a production fab? Was the tool newly installed, recently upgraded, or operating with an established maintenance history? A single system at a carefully supported site may not represent a broader installed base.
Where customer confidentiality limits disclosure, request an anonymized breakdown of the fleet, operating period, and selection criteria. Be cautious if only the best-performing month or tool is presented. A useful report should explain missing records, excluded systems, and major changes to hardware, software, or maintenance practice during the measurement period.
Why do CMP process conditions matter so much?
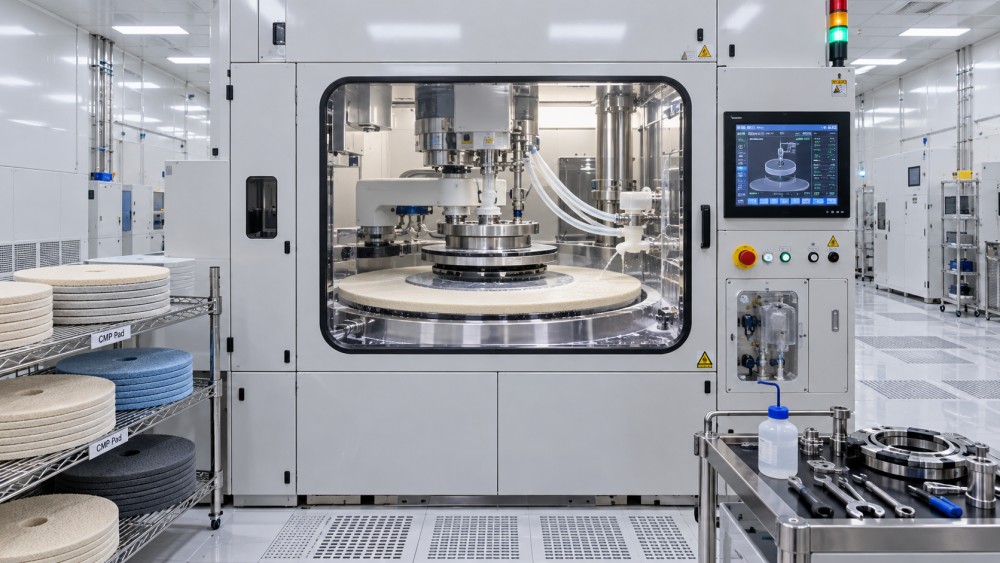
Uptime is tied to what the equipment is asked to process. CMP performance depends on the integration of polishing modules, pads, conditioners, slurry delivery, cleaning, and process control. Differences in wafer size, film stack, removal requirements, recipe duration, and contamination controls can change maintenance frequency and recovery effort.
A claim based on one material or stable recipe mix may not transfer neatly to a fab running several qualified processes with frequent changeovers. Likewise, a system with different numbers of polishing or cleaning modules may have a different relationship between a component failure and whole-tool availability. Ask whether a disabled module allows restricted operation, reduces capacity, or stops the entire system—and how that condition is classified in the uptime report.
Consumables deserve particular attention. Pad life, conditioning strategy, slurry characteristics, and cleaning requirements affect both planned interventions and process stability. Request the conditions behind the reported figure, but avoid assuming that the same consumable replacement intervals will hold under your own recipes.
Is high uptime the same as high wafer output?
No. A CMP tool can be available for a large share of the reporting period and still deliver less output than expected. Processing speed, wafer handling, recipe mix, changeovers, metrology holds, and the number of available modules all affect throughput. Utilization also matters: an available tool may be idle because the fab does not have wafers ready for it.
Compare uptime with sustained output under a stated operating scenario, rather than multiplying a headline uptime percentage by a maximum throughput claim. Ask for completed wafers over the same period, the product and recipe mix, and the treatment of rework and qualification wafers. If a supplier reports throughput only for a single recipe or an ideal configuration, it should be labeled accordingly.
Quality must remain part of the conversation. Output is less useful if it comes with process excursions, additional inspection, or rework. Where data is available, review process stability and qualification results alongside equipment availability, without assuming that a single uptime metric explains yield.
Which reliability and maintenance measures should accompany uptime?
Availability describes a result; failure and repair data help explain how it was achieved. Request the number and type of failures, the distribution of repair times, and the most common causes of downtime. Mean time between failures and mean time to repair can be helpful, but only when the supplier explains what counts as a failure, when the repair clock starts and stops, and whether waiting time is included.
Averages can conceal awkward operational realities. Several short interruptions may disrupt scheduling differently from one long failure waiting for an imported component. Look for the longest events, repeat faults, and time spent on diagnosis, parts delivery, repair, and return to qualified production. Ask whether preventive maintenance completion rates and staffing levels were unusual during the observation period.
What service and spare-parts evidence should procurement request?
An uptime claim reflects a support environment, not just a machine design. A supplier’s reference site may have resident engineers, locally stocked components, or rapid access to factory specialists. A new installation in another region may not receive the same support unless it is specified in the agreement.
- Where are critical spares stocked, and which parts have long replenishment lead times?
- What service coverage is available locally, including shifts, holidays, and escalation routes?
- What training and diagnostic access will fab maintenance staff receive?
- Who supplies software updates, remote support, and process recovery assistance?
- What parts, labor, consumables, and travel costs are included in warranty or service terms?
Distinguish a contracted response commitment from a demonstrated repair time. An engineer arriving quickly does not guarantee that the required part is available or that the process can immediately return to production. For geographically concentrated supply chains, ask how support would continue if a shipment or specialist were delayed.
How should uptime be tested during equipment acceptance?
Build an acceptance plan around the intended configuration and a mutually agreed operating scenario. It should specify the measurement window, eligible wafers and recipes, tool states, maintenance treatment, data source, and the procedure for resolving disputed events. Define whether the test measures whole-tool availability, module availability, sustained output, or several of these separately.
The plan should also say who provides operators, consumables, utilities, and qualification wafers, and how interruptions outside the equipment supplier’s control are recorded. Short acceptance tests cannot establish long-term reliability on their own. Use them to verify defined capabilities, then assess longer-term performance through a production monitoring period where feasible.
Before issuing a request for quotation, give every supplier the same reporting template and ask for supporting records. If one claim remains stronger only under its original exclusions, that is not necessarily a reason to reject the tool—but it is a reason to understand the operating cost and risk behind the number. The best comparison makes those differences explicit enough for engineering, operations, and procurement to make the decision together.
Questions about market trends? Contact Market Scope Live for deeper business insights.
We respect your privacy. Your information is strictly confidential.
We respect your privacy. Your information is strictly confidential.
Related News
 Performance BenchmarksHow does downtime affect semiconductor equipment throughput?Discover how downtime affects semiconductor manufacturing equipment throughput, from lost wafer capacity to recovery delays, and learn practical ways to improve qualified output.MORE+
 Performance BenchmarksHow Should You Compare CMP Equipment Uptime Claims?How should I compare CMP equipment uptime claims? Learn to uncover exclusions, normalize availability data, and assess service support before you buy.MORE+
 Performance BenchmarksCan photomask inspection equipment detect smaller defects?Photomask Inspection Equipment can detect smaller defects—but how reliably? Explore sensitivity, throughput, and key tests to make a confident purchase.MORE+