Why Is Ultrapure Water Resistivity Dropping?
Author
Date Published
Reading Time
Ultrapure water resistivity drops when the water contains more electrically conductive ions, when its temperature changes, or when the measurement system reports an inaccurate value. In a semiconductor water system, the source can be upstream purification equipment, a distribution loop, a point-of-use branch, or the sampling and sensor arrangement itself. The first useful distinction is whether the decline is real and where it begins.
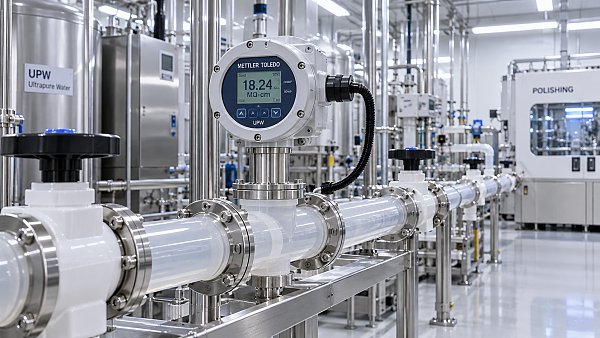
Resistivity measures resistance to electrical current and is commonly reported in megohm-centimeters (MΩ·cm). At 25°C, the theoretical resistivity of pure water is approximately 18.2 MΩ·cm. A lower reading indicates higher conductivity, but it does not identify the contaminant. Organic compounds, particles, microorganisms, and dissolved silica also require attention even when resistivity remains high.
Is the drop real or a measurement effect?
Begin with the trend rather than the latest reading alone. A sudden step change, a gradual decline over several days, and brief dips during high demand suggest different causes. Record the affected measurement point, the time of the change, flow conditions, temperature, and any maintenance or process events occurring around it.
Temperature is especially important. Water conductivity changes with temperature, so instruments often display a value compensated to 25°C. Compare compensated readings only when the instruments use appropriate settings for high-purity water. An incorrect temperature sensor, compensation mode, or configuration can create an apparent change even though the water has not changed in the same way. Compare the displayed temperature and, where available, the uncompensated conductivity as well as the compensated resistivity.
Examine the sensor installation before attributing the drop to the purification plant. A sensor exposed to a stagnant pocket, a partly filled line, trapped gas, or unstable flow may not represent the circulating water. Deposits on a conductivity cell, damaged wiring, moisture in a connector, or an incorrect cell constant can also distort the result. Follow the instrument manufacturer's verification procedure; a meter designed for ordinary water is not automatically suitable for measurements near the ultrapure range.
Confirm the reading with a suitable calibrated instrument at the same location and under comparable flow and temperature conditions. A separate inline measurement is preferable when available. An open bottle sample is a poor substitute: contact with air can introduce carbon dioxide, and the container can release ionic residues. A clean sampling arrangement and minimal air exposure matter even when the sample is analyzed quickly.
Where does the resistivity first fall?
Compare readings in the direction of water flow: after the main purification stages, at the polishing outlet, on the distribution supply and return, and at the affected point of use where measurements are available. Allow for transport time and differences in sensor response. Readings from different locations are useful only when their timestamps and operating conditions are comparable.
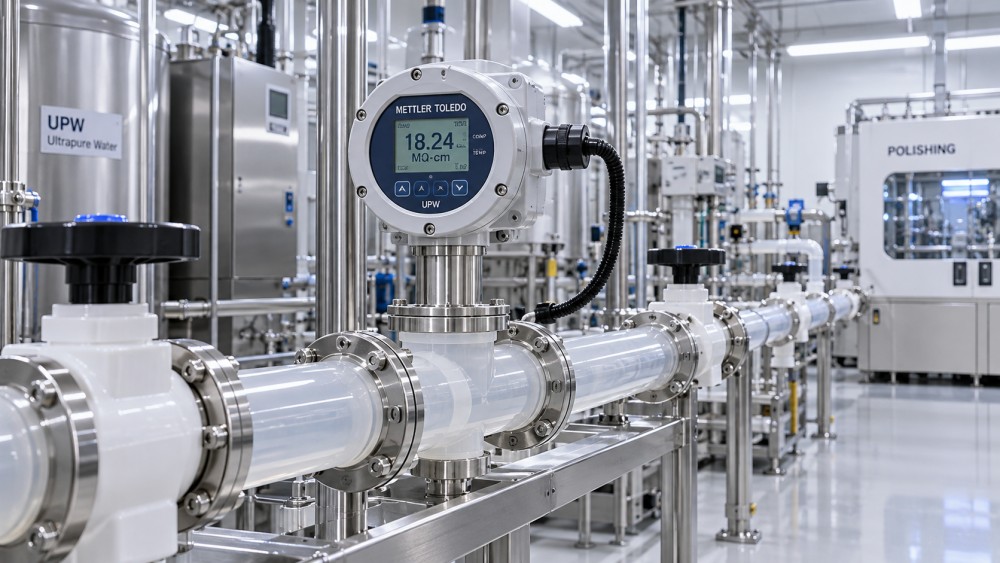
If the polishing outlet and several downstream locations decline together, investigate the upstream feed and treatment stages. If the outlet remains stable while the loop return deteriorates, contamination may be entering or being generated within the distribution system. A problem confined to one branch points toward that branch's piping, valve, filter, tool connection, or measurement point. These patterns narrow the search; they do not prove a specific failure without further evidence.
A supply-to-return difference deserves careful interpretation. Water returning from a loop has passed additional surfaces and connections, but the return sensor may also be located near a branch with intermittent flow. Compare the difference during steady circulation and during normal demand before deciding that the entire loop is contaminated.
What introduces ions into the water?
Exhausted or compromised polishing media
Ion-exchange resin and electrodeionization equipment remove ionic species, but their performance depends on feedwater quality, operating conditions, and maintenance. A gradual decline after a long stable period can indicate resin exhaustion or a change in the load reaching the polisher. A sudden deterioration immediately after a resin change can instead point to insufficient rinsing, unsuitable media, an installation error, or a bypass.
For electrodeionization, review the unit's operating indications, including flow, electrical conditions, and any alarms, against its approved operating limits. An abnormal value is a lead for investigation, not by itself proof that the module has failed. Feedwater with increased ionic load or a malfunctioning upstream membrane can also reduce the margin available to the polishing stage.
When a treatment vessel has been isolated or returned to service, verify valve positions and the actual flow path. A bypass left open can produce a drop that resembles exhausted media. A downstream reading may improve after a vessel is taken offline, but that observation must be interpreted with the changed flow and mixing conditions in mind.
Carbon dioxide and air exposure
Carbon dioxide dissolves in water and forms ionic species, increasing conductivity. Air ingress through a tank vent, a loose connection, a sampling point, or an unsuitable gas interface can therefore lower resistivity. A degasification stage that is not performing as intended can leave more dissolved gas for downstream polishing equipment to handle.
Carbon dioxide is also a common source of misleading samples. A laboratory result obtained after collecting water in an open container should not be treated as directly equivalent to an inline measurement without considering the collection method. If the inline reading is stable but the bottle sample falls rapidly, investigate exposure during sampling before changing the treatment system.
Components, maintenance, and chemical residues
New piping, seals, valves, filters, and instrument components can release trace ionic material until they have been appropriately cleaned and flushed. A drop following installation is therefore different from a decline that began months later. Review the material's suitability, cleaning record, rinse procedure, and the point at which the component was connected to the live system.
Cleaning or sanitization residues can also cause a sharp conductivity increase. Confirm that rinse water meets the site's release criteria at the relevant outlet, not solely at the start of the loop. Water trapped in a low-flow branch can re-enter the system later, creating a delayed dip after the main line appeared to recover.
Corrosion products, seal degradation, and contamination introduced during a repair are other possibilities. A filter may capture particles while dissolved ions continue downstream, so a normal particle result does not exclude an ionic source. Conversely, a conductivity improvement after flushing does not establish that particles or organic residues have also been removed.
Why does the reading drop only during production?
A demand-related dip often appears when several tools draw water at once. Higher flow can expose limited treatment capacity, change the blend of water from different paths, or draw water from a branch that has remained stagnant. Compare the trend with flow, tank level, pump operation, and valve changes. A stable reading at low demand does not establish that the system maintains the same quality at peak demand.
The timing helps separate possibilities. A dip that begins as a particular valve opens and clears after sustained flow suggests a local branch or connected tool. A dip that follows rising overall demand and appears at several points suggests a shared supply or treatment issue. If the signal changes before a corresponding flow change is physically possible at the sensor location, investigate the measurement and control signals as well.
Do not assume that more flushing is always harmless or sufficient. Flushing can move contaminated water into another part of the loop, consume storage capacity, or mask an intermittent source. Use the site's approved routing and confirm where the flush discharge goes. Isolate a suspect branch only under the established operating procedure, particularly when process tools depend on continuous supply.
Can resistivity identify the contaminant?
No. Different ions contribute differently to conductivity, and the same resistivity can result from different mixtures. The instrument also does not distinguish a small increase in several ions from a larger increase in one species. Use targeted analysis, such as ion chromatography, when identifying an ionic contaminant will change the investigation or corrective action. Sample collection, container preparation, blanks, and detection limits must be appropriate for the expected concentrations.
Resistivity alone is even less informative about neutral contaminants. Total organic carbon monitoring, particle counts, microbial monitoring, and dissolved oxygen or silica measurements address different properties of water. Their relevance and acceptance limits depend on the process and the established monitoring plan. A resistivity reading near the theoretical maximum is not evidence that all of those attributes meet a tool's requirements.
When is water acceptable to return to service?
Use the applicable site and process limits at the relevant point of use. The theoretical 18.2 MΩ·cm value is a reference at 25°C, not a universal release criterion. A system can display a high resistivity at the central plant while a branch or tool inlet remains outside its own requirements.
After the suspected cause has been corrected, verify the reading under representative circulation and demand, not only immediately after a flush. Review the stability of upstream and downstream measurements, confirm that affected branches have been returned to their intended configuration, and complete any additional contamination tests required by the process. Where water has already reached production equipment during an excursion, the disposition of affected material and any tool recovery should follow the site's established procedures.
A brief recovery followed by another decline is useful evidence: it suggests that a source remains, a low-flow volume is returning to circulation, or the measurement problem has not been resolved. Preserve the trend and operating records before making further changes so the next investigation can distinguish recurrence from a new event.
Questions about market trends? Contact Market Scope Live for deeper business insights.
We respect your privacy. Your information is strictly confidential.
We respect your privacy. Your information is strictly confidential.
Related News
 Process MaterialsHow does the photomask manufacturing process transfer a pattern?Discover how the photomask manufacturing process turns circuit layouts into precise mask patterns and transfers them to wafers through lithography.MORE+
 Process MaterialsWhy do EUV photomasks use reflective multilayer structures?EUV photomasks use reflective multilayers to overcome absorption at 13.5 nm. Discover how mirror design, imaging and defect control affect performance.MORE+
 Process MaterialsHow are photomasks used in semiconductor lithography?Photomasks for semiconductor lithography shape chip features layer by layer. Explore DUV and EUV masks, defect control, and their impact on manufacturing yield.MORE+
 Process MaterialsHow does sputtering target purity affect thin-film quality?Sputtering Targets can shape thin-film quality and process consistency. Discover how purity, contamination, and qualification affect your results.MORE+
 Process MaterialsHow buried oxide thickness affects silicon-on-insulator wafersSilicon-on-Insulator Wafers depend on buried oxide thickness for isolation, heat dissipation, and device control. Explore the trade-offs and choose the right stack.MORE+
 Process MaterialsWhy Is Ultrapure Water Resistivity Dropping?Why is ultrapure water resistivity dropping? Discover common causes, measurement pitfalls, and practical troubleshooting steps to restore water quality.MORE+
 Process MaterialsHow etch selectivity affects semiconductor fabricationSemiconductor Etchants shape selectivity, mask survival, and device quality. Discover how to balance material protection, profile control, and process efficiency.MORE+
 Process MaterialsChoosing semiconductor encapsulation materials for high-humidity environmentsSemiconductor Encapsulation Materials for high-humidity environments: compare moisture resistance, adhesion, reliability testing and production trade-offs.MORE+